Whether you are a prospective buyer or seller, understanding these metrics can provide valuable insights into the current market conditions.
Firstly, let's discuss the Months’ Supply of Inventory, which currently stands at 2.45. This metric represents the number of months it would take to sell all the available homes on the market, assuming no new listings come in. A lower number indicates a seller's market, where demand outweighs supply, leading to potential bidding wars and higher prices.
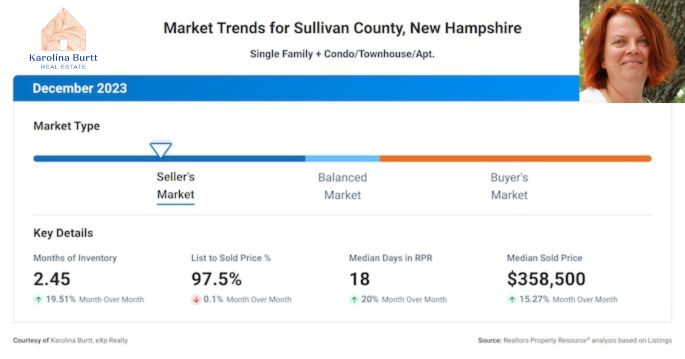
Now, let's take a closer look at the 12-Month Change in Months of Inventory, which shows a staggering increase of 59.09%. This tells us that the inventory of homes for sale has significantly increased over the past year. This rise in inventory could be attributed to various factors, such as an influx of new listings or a decrease in buyer demand. It suggests that we may be transitioning from a seller's market to a more balanced market, providing buyers with more options and potentially negotiating power.
Moving on, we have the Median Days Homes are On the Market, which currently stands at 18. This metric represents the average number of days it takes for a home to sell from the day it is listed. A lower number indicates a faster-paced market characterized by high demand and quick sales. With homes selling in just 18 days, it's evident that the market is quite active at the moment, reflecting strong buyer interest and a sense of urgency to secure a property.
Next, let's discuss the List to Sold Price Percentage, which currently stands at 97.5%. This metric represents the percentage of the original listing price that homes are selling for. A higher percentage indicates that sellers are receiving offers close to their asking price. In this case, with a percentage of 97.5%, sellers can be pleased to know that they are achieving a high percentage of their initial asking price, suggesting a healthy market where buyers are willing to pay close to the listed price.
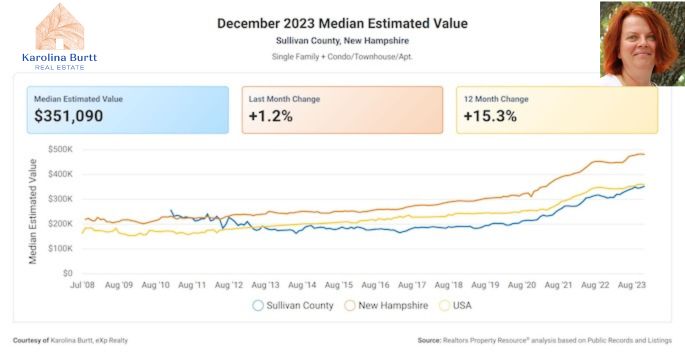
Lastly, we have the Median Sold Price, which currently sits at $358,500. This metric represents the middle point of all the sold prices in a given period. It provides a snapshot of the market's overall pricing trends. With a median sold price of $358,500, it indicates that this is the price point at which half of the homes sold above and half sold below. This figure can serve as a reference point for both buyers and sellers, helping them gauge the current market value of properties.

In summary, the correlation between these real estate metrics paints an interesting picture for both buyers and sellers. The increase in the Months Supply of Inventory suggests a shift towards a more balanced market, providing buyers with more options and potentially more negotiating power. However, the low Median Days Homes are On the Market and the high List to Sold Price Percentage indicate strong buyer interest and a willingness to pay close to the asking price. Finally, the Median Sold Price gives us an idea of the current market value of properties.