Today, we will delve into the world of real estate and explore the correlation between several key metrics. Whether you are a buyer or a seller, understanding these metrics can greatly enhance your decision-making process.
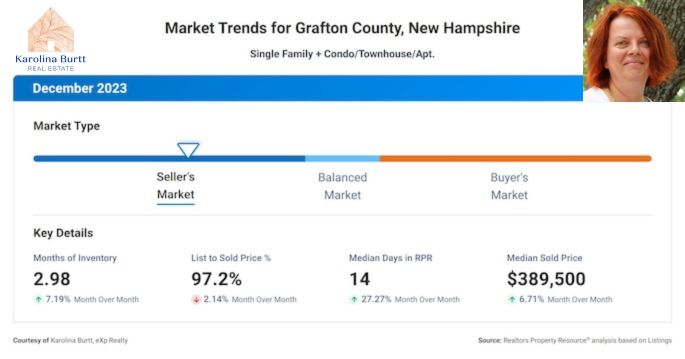
Firstly, let's take a look at the "Months’ Supply of Inventory." This metric indicates the number of months it would take to sell all the current listings in the market, assuming no new listings are added. In our case, the months supply of inventory stands at 2.98. This figure suggests that, based on the current rate of sales, it would take approximately 2.98 months to deplete the entire inventory.
Now, let's consider the "12-Month Change in Months of Inventory." This metric measures the percentage change in the months supply of inventory over the past year. In our analysis, we observe a significant increase of 61.96% in this metric. This indicates that the market has experienced a notable rise in the number of available listings, potentially creating a more favorable environment for buyers.
Moving on, we come to the "Median Days Homes are On the Market." This metric provides insights into how long it takes, on average, for homes to sell. In our case, the median is just 14 days, indicating a relatively fast-paced market. This suggests that properties are being snatched up quickly, making it imperative for both buyers and sellers to act swiftly and decisively.
Next, let's explore the "List to Sold Price Percentage." This metric measures the percentage difference between the initial list price of a property and the final sold price. Our analysis reveals a list to sold price percentage of 97.2%, indicating that, on average, homes are selling very close to their initial list price. This figure suggests that sellers are achieving their desired prices, while buyers may need to be prepared to negotiate to secure a favorable deal.
Finally, we come to the "Median Sold Price." This metric provides a snapshot of the midpoint price at which homes are being sold. In our analysis, the median sold price stands at $389,500. This figure serves as a helpful benchmark for both buyers and sellers, allowing them to gauge the current market value of properties in the area.
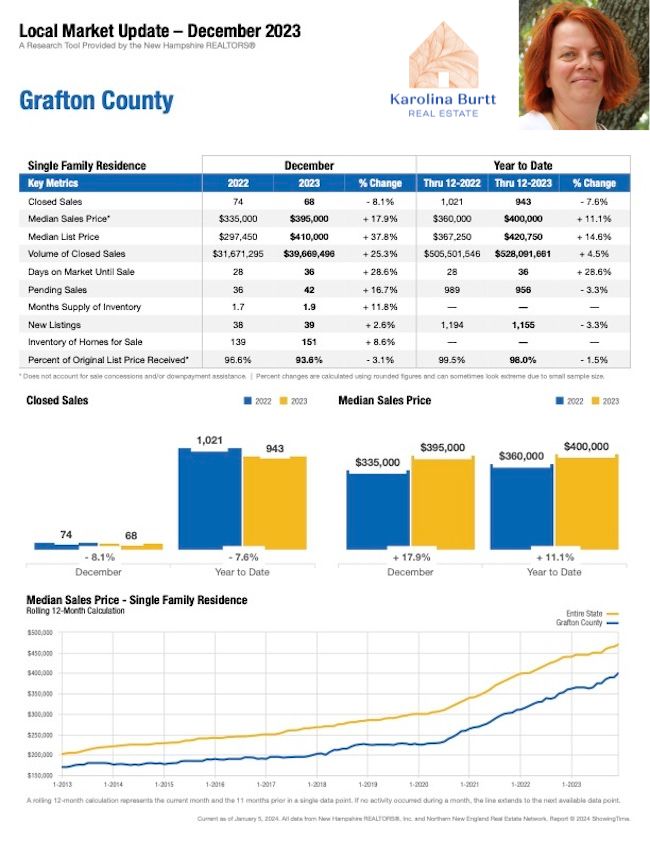
Now, let's tie all these metrics together. The months supply of inventory and the significant increase in the 12-month change in months of inventory indicate a market that is becoming more favorable to buyers. The relatively short median days homes are on the market further supports this hypothesis, as properties are being snapped up swiftly. However, sellers can take comfort in the list to sold price percentage, which suggests that they are achieving prices close to their initial expectations.
Overall, buyers can expect to face a competitive market, with limited inventory and a need for quick decision-making. On the other hand, sellers can anticipate achieving favorable prices, given the current conditions. Armed with this knowledge, both buyers and sellers can navigate the real estate landscape with confidence and make informed decisions that align with their goals.